
Opdrachtomschrijving:
Empower 2.0 challenged us to design a toolkit that supported green energy enthusiasts and initiatives in meeting their city’s energy transition goals. The toolkit must show the data in a clear and simple way so it can be accessible for all stakeholders.
Eindresultaat:
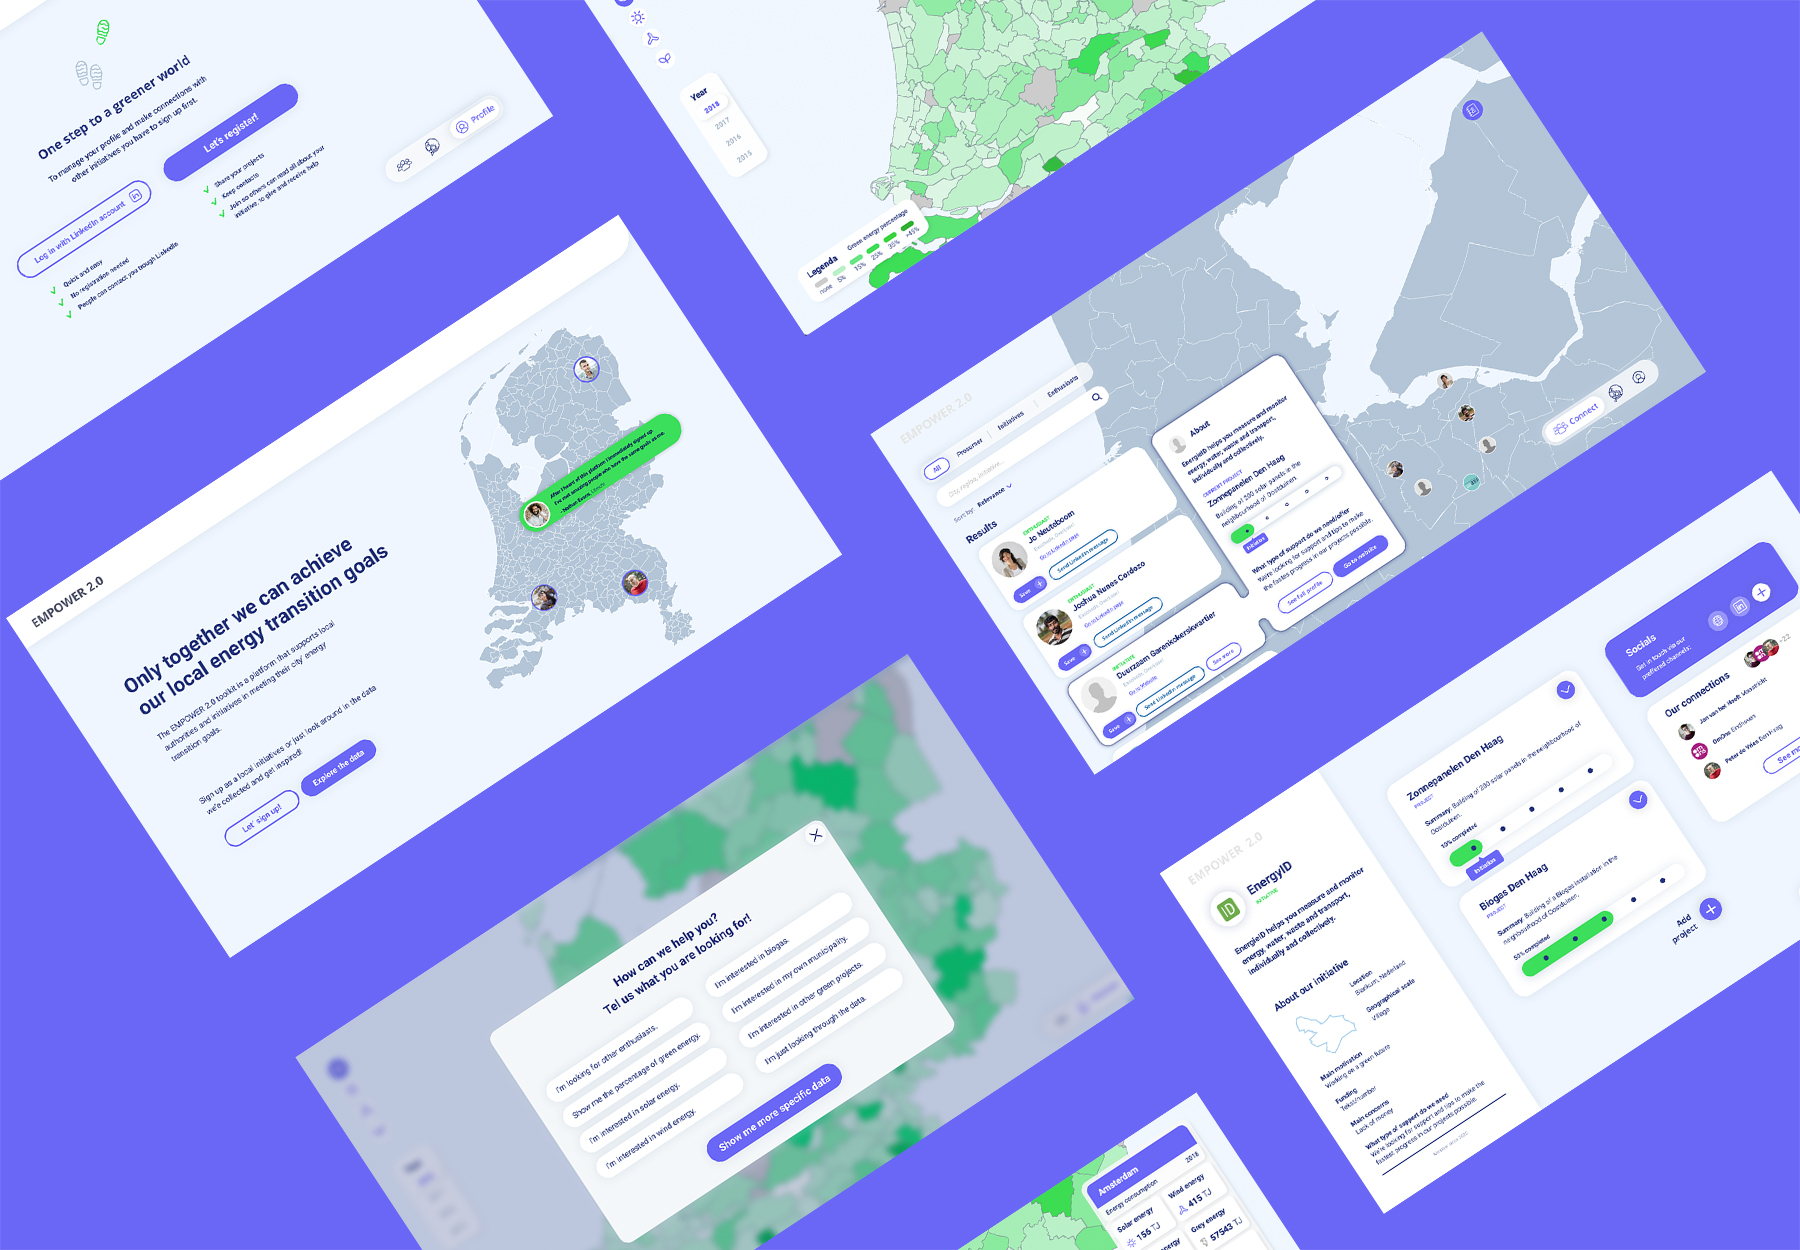
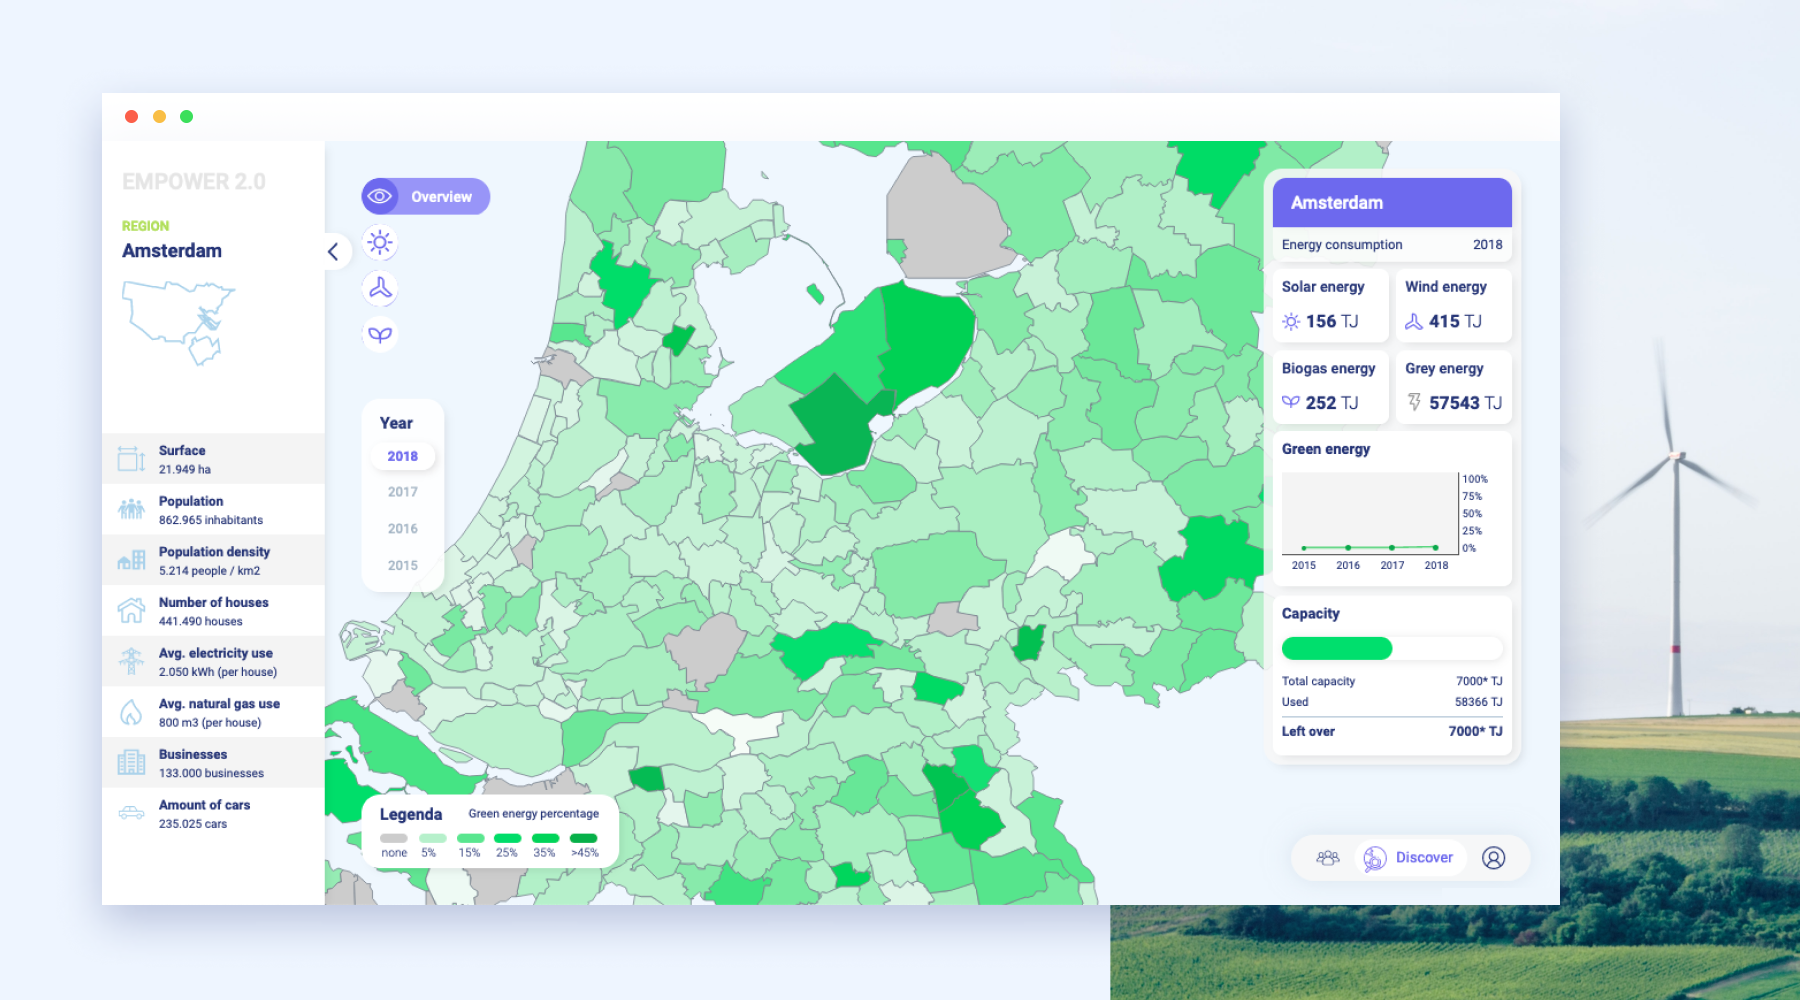
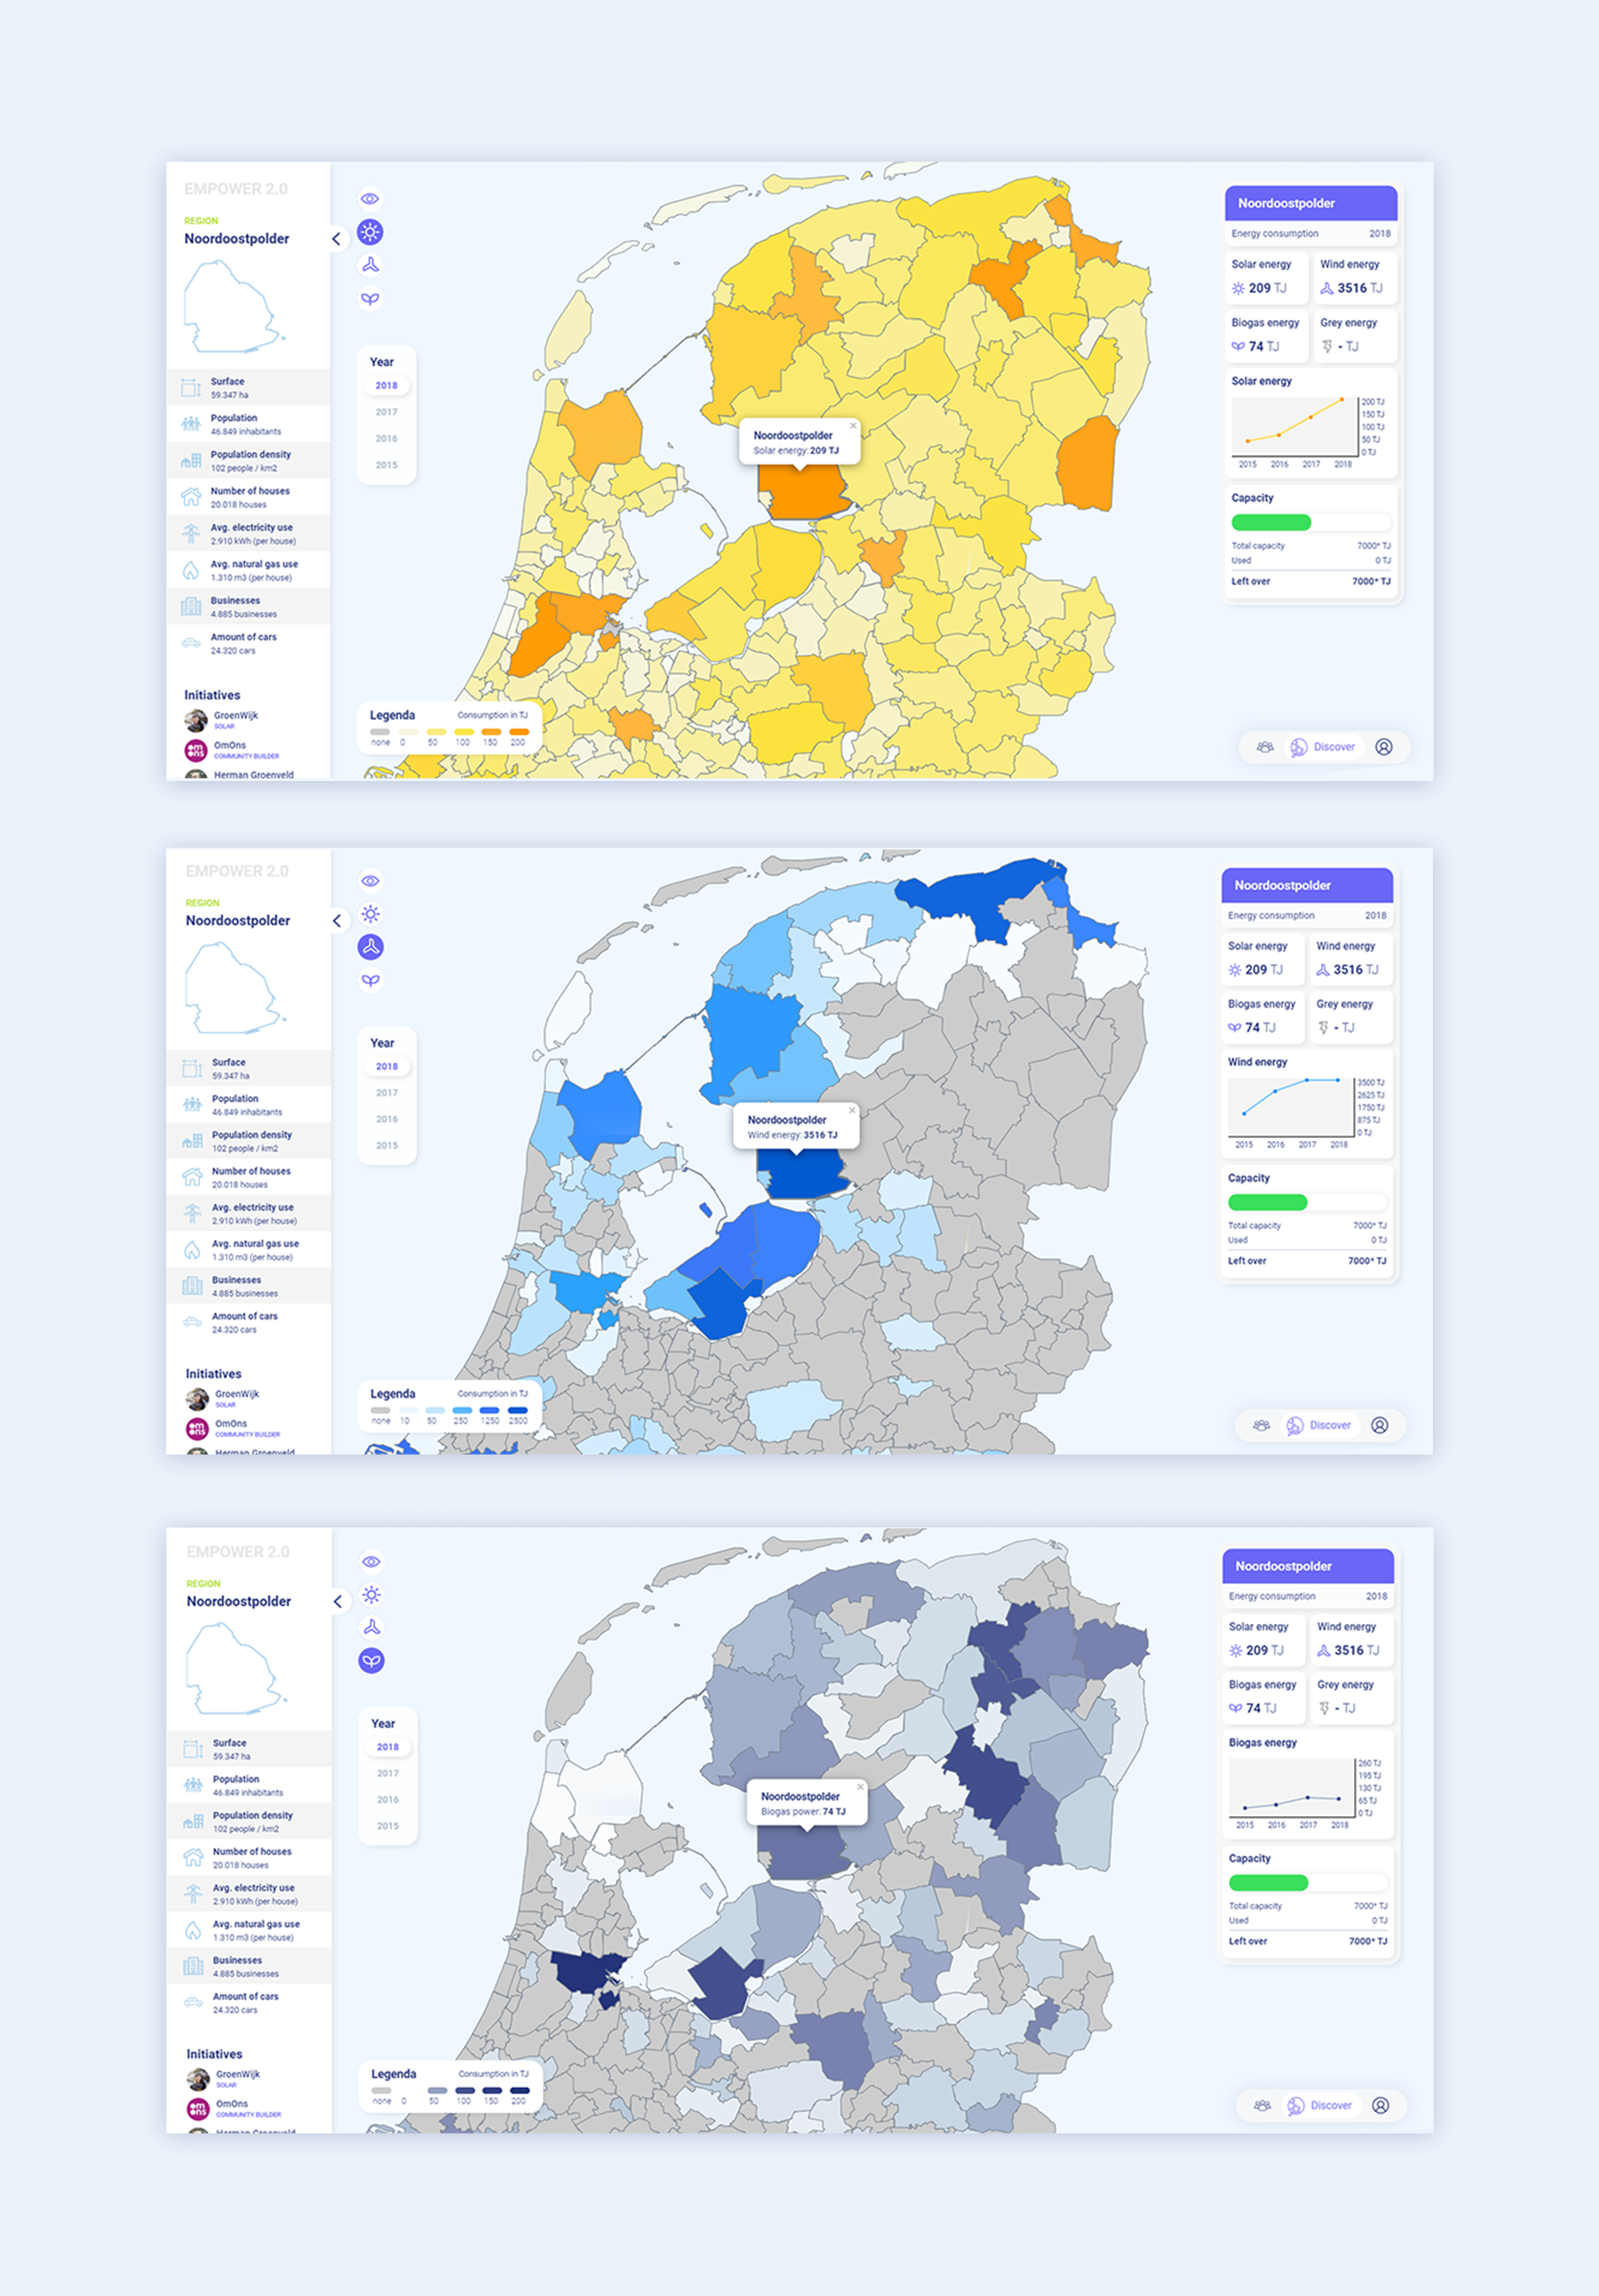
The most importent part of our project was visualizing the green energy situation and make complex data insightful. We made an interactive map that shows which municipality is on the right track. We bring the data forward by using microinteractions: clicking and hovering on any part of the map will show more data. Users can easily compare the municipalities, to see where the best opportunities lie and whether there is still capacity for improvement. To achieve your energy transition goals, you have to work together. So aside from showing the green energy data as a center point, we also wanted to create a community. We did so by adding profiles to the platform with a LinkedIn API, to be familiar and easy-to-use for our target audience. These profiles can find eachother on the map to learn about their projects and get in touch.
Link(s) naar meer info / demo(s) / filmpjes van het project:
Afbeeldingen:

Om het Procesboek te bekijken is dit de link!
https://empower2.notion.site/Empower-2-0-homepage-96757fe5d8f54d70acdf37b24a9a7642